
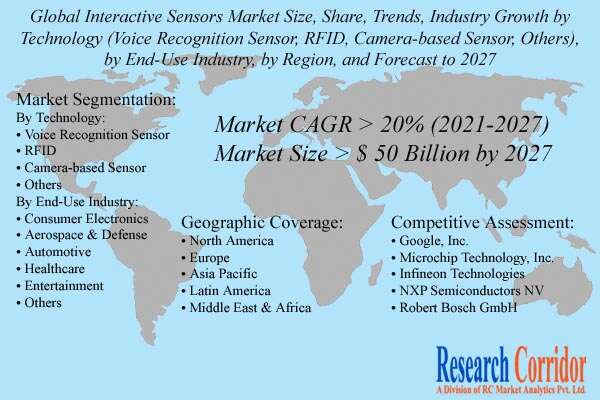
The global interactive sensors market size is anticipated to register a significant CAGR of over 20% during the forecast period and estimated to reach over USD 50 billion by 2027. The rising demand for interactive gaming around the world is one of the key factor to drive the market growth. Furthermore, the increasing focus to provide a better real-time experience and the emphasis on the physical and active involvement of players in the game is further anticipated to boost the market growth over the forecast period. Moreover, the rising penetration of interactive sensors in autonomous vehicles, interactive televisions, and smart homes is expected to fuel the global market
Market Drivers:
Increasing Demand for Interactive and Smart Devices: The growing adoption of interactive and smart devices, such as smartphones, tablets, wearable devices, gaming consoles, and smart home appliances, drives the demand for interactive sensors. These sensors enable touch, motion, proximity, and gesture-based interactions, enhancing the user experience and functionality of these devices.
Advancements in Sensor Technologies: Continuous advancements in sensor technologies, such as capacitive, resistive, optical, and ultrasonic sensors, contribute to the growth of the interactive sensors market. These advancements result in improved sensitivity, accuracy, responsiveness, and power efficiency, enabling seamless and intuitive user interactions with devices and systems.
Internet of Things (IoT) and Connected Devices: The proliferation of IoT and connected devices creates opportunities for interactive sensors. These sensors play a crucial role in enabling communication and interaction between devices, facilitating seamless data exchange and control. The increasing deployment of IoT applications, such as smart homes, industrial automation, healthcare monitoring, and transportation systems, drives the demand for interactive sensors.
Rising Demand for Virtual and Augmented Reality (VR/AR): The growing popularity of virtual and augmented reality applications in gaming, entertainment, training, and simulation drives the demand for interactive sensors. Sensors such as gyroscopes, accelerometers, and proximity sensors enable motion tracking, spatial mapping, and gesture recognition, enhancing the immersive experience in VR/AR environments.
Automotive Industry Innovations: The automotive industry is embracing advanced driver assistance systems (ADAS), infotainment systems, and in-vehicle interactive technologies. Interactive sensors are essential components of these systems, enabling touchscreens, gesture controls, voice recognition, and proximity-based functionalities. The increasing integration of interactive sensors in vehicles drives market growth.
User-Centric Design and User Experience: User-centric design and enhanced user experience have become key considerations for product development across various industries. Interactive sensors play a vital role in delivering intuitive, responsive, and engaging user interfaces. The focus on user experience drives the demand for interactive sensors in consumer electronics, appliances, automotive, and other sectors.
Industrial Automation and Human-Machine Interfaces (HMI): The adoption of industrial automation and robotics in manufacturing and industrial processes requires intuitive and efficient human-machine interfaces. Interactive sensors enable touchscreens, haptic feedback, and gesture-based controls in industrial settings, enhancing productivity, safety, and ease of operation. The industrial automation sector drives the demand for interactive sensors.
Healthcare and Medical Applications: Interactive sensors find applications in healthcare and medical devices, such as wearable health trackers, fitness monitors, smartwatches, and medical diagnostic equipment. These sensors enable real-time monitoring, motion tracking, and touch-based interactions, contributing to improved healthcare delivery, patient monitoring, and rehabilitation.
Gaming and Entertainment Industry: The gaming and entertainment industry is a significant driver of interactive sensor demand. Motion sensors, gesture recognition sensors, and touchscreens enable immersive gaming experiences and interactive entertainment platforms. The growing popularity of gaming consoles, virtual reality systems, and mobile gaming drives the demand for interactive sensors.
Continuous Technological Innovations and Miniaturization: Continuous technological innovations, miniaturization of sensors, and the integration of multiple sensor functions into a single device drive market growth. Smaller form factors, lower power consumption, and increased sensor capabilities enable the integration of interactive sensors into various devices and systems, expanding their application potential.
Market Snapshot:
| Benchmark Year | 2022 | ||
| Market Size | > USD 50 Billion by 2027 | ||
| Market Growth (CAGR) | > 20% (2023-2030) | ||
| Largest Market Share | North America | ||
| Analysis Period | 2020-2030 | ||
| Market Players | Google, Inc., Microchip Technology, Inc., Infineon Technologies, NXP Semiconductors NV, and Robert Bosch GmbH |
Market Insights:
The global interactive sensors market is bifurcated into technology, end-use industry, and geography. On the basis of the end-use industry, the market is further segmented into consumer electronics, aerospace & defense, automotive, healthcare, entertainment, and others. The consumer electronics segment dominated the global market in 2020 and is expected to hold the largest revenue share of around one-third of the market by the end of the analysis period. The increasing penetration of smart devices is one of the prominent factor to drive the segment growth. Furthermore, technological advancement and the increasing demand for interactive gaming are further expected to fuel the segment growth.
To know more about the report, request sample papers
The interactive sensors comprehensive study analyzes industry trends, market size, competitive analysis, and market forecast – 2021 to 2027. Research Corridor report provides detailed premium insight into the global market and reveals the potential revenue streams, commercial prospects, market drivers, challenges, opportunities, issues, and events affecting the industry. In addition, the report has a dedicated section covering market forecasts and analysis for leading geographies, profiles of major companies operating in the market and expert opinion obtained from interviews with industry executives and experts from prominent companies.
The interactive sensors market research report presents the analysis of each segment from 2018 to 2027 considering 2020 as the base year for the research. The compounded annual growth rate (CAGR) for each respective segment is calculated for the forecast period from 2021 to 2027.
Historical & Forecast Period
- 2018-19 – Historical Year
- 2020 – Base Year
- 2021-2027 – Forecast Period
Market Segmentation:
By Technology:
- Voice Recognition Sensor
- RFID
- Camera-based Sensor
- Others
By End-Use Industry:
- Consumer Electronics
- Aerospace & Defense
- Automotive
- Healthcare
- Entertainment
- Others
By Region:
- North America
- Europe
- Asia Pacific
- Latin America
- Middle East & Africa
Geographic Coverage
Geographically, North America dominated the global interactive sensors market in 2020 and estimated to hold the largest revenue share of around one-third of the market by the end of the analysis period. the early adoption of the new technologies is one of the major factor to drive the market growth in the region. Furthermore, the increasing penetration of smartphones and increasing demand for interactive gaming are further anticipated to fuel the market growth in North America. On the other hand, the Asia Pacific is expected to grow at a significant growth rate due to the growing demand for automobiles in the emerging market.
Competitive Assessment
Some of the leading market players operating in the global interactive sensors market are Google, Inc., Microchip Technology, Inc., Infineon Technologies, NXP Semiconductors NV, and Robert Bosch GmbH. Companies are exploring markets through expansion, new investment, the introduction of new services, and collaboration as their preferred strategies. Players are exploring new geography through expansion and acquisition to gain a competitive advantage through joint synergy.
Key Companies:
- Google, Inc.
- Microchip Technology, Inc.
- Infineon Technologies
- NXP Semiconductors NV
- Robert Bosch GmbH
- Texas Instruments
- Acconeer AB
- Analog Devices, Inc.
- Omron Corporation
- ABB Ltd.
Key Questions Answered by Interactive Sensors Market Report
- Global interactive sensors market forecasts from 2021-2027
- Regional interactive sensors market forecasts from 2021-2027 covering Asia-Pacific, North America, Europe, Middle East & Africa, and Latin America
- Country-level forecasts from 2021-2027 covering 15 major countries from the regions as mentioned above
- Interactive sensors submarket forecasts from 2021-2027 covering the market by technology, by end-use industry, and geography
- Various industry models such as SWOT analysis, Value Chain Analysis about interactive sensors market
- Analysis of the key factors driving and restraining the growth of the global, regional, and country-level interactive sensors markets from 2021-2027
- Competitive Landscape and market positioning of top 10 players operating in the interactive sensors market
1. Preface
1.1. Report Description
1.1.1. Purpose of the Report
1.1.2. Target Audience
1.1.3. USP and Key Offerings
1.2. Research Scope
1.3. Research Methodology
1.3.1. Phase I – Secondary Research
1.3.2. Phase II – Primary Research
1.3.3. Phase III – Expert Panel Review
1.4. Assumptions
2. Executive Summary
2.1. Global Interactive Sensors Market Portraiture
2.2. Global Interactive Sensors Market, by Technology, 2020 (USD Mn)
2.3. Global Interactive Sensors Market, by End-Use Industry, 2020 (USD Mn)
2.4. Global Interactive Sensors Market, by Geography, 2020 (USD Mn)
3. Global Interactive Sensors Market Analysis
3.1. Interactive Sensors Market Overview
3.2. Market Inclination Insights
3.3. Market Dynamics
3.3.1. Drivers
3.3.2. Challenges
3.3.3. Opportunities
3.4. Attractive Investment Proposition
3.5. Competitive Analysis
3.6. Porter’s Five Force Analysis
3.6.1. Bargaining Power of Suppliers
3.6.2. Bargaining Power of Buyers
3.6.3. Threat of New Entrants
3.6.4. Threat of Substitutes
3.6.5. Degree of Competition
3.7. COVID-19 Impact Analysis
4. Global Interactive Sensors Market By Technology, 2018 – 2027 (USD Mn)
4.1. Overview
4.2. Voice Recognition Sensor
4.3. RFID
4.4. Camera-based Sensor
4.5. Others
5. Global Interactive Sensors Market By End-Use Industry, 2018 – 2027 (USD Mn)
5.1. Overview
5.2. Consumer Electronics
5.3. Aerospace & Defense
5.4. Automotive
5.5. Healthcare
5.6. Entertainment
5.7. Others
6. North America Interactive Sensors Market Analysis and Forecast, 2018 – 2027 (USD Mn)
6.1.1. Overview
6.1.2. North America Interactive Sensors Market by Technology (2018-2027 USD Mn)
6.1.3. North America Interactive Sensors Market by End-Use Industry (2018-2027 USD Mn)
6.1.4. North America Interactive Sensors Market by Country (2018-2027 USD Mn)
6.1.4.1. U.S.
6.1.4.1.1. U.S. Interactive Sensors Market by Technology (2018-2027 USD Mn)
6.1.4.1.2. U.S. Interactive Sensors Market by End-Use Industry (2018-2027 USD Mn)
6.1.4.2. Canada
6.1.4.2.1. Canada Interactive Sensors Market by Technology (2018-2027 USD Mn)
6.1.4.2.2. Canada Interactive Sensors Market by End-Use Industry (2018-2027 USD Mn)
7. Europe Interactive Sensors Market Analysis and Forecast, 2018 – 2027 (USD Mn)
7.1.1. Overview
7.1.2. Europe Interactive Sensors Market by Technology (2018-2027 USD Mn)
7.1.3. Europe Interactive Sensors Market by End-Use Industry (2018-2027 USD Mn)
7.1.4. Europe Interactive Sensors Market by Country (2018-2027 USD Mn)
7.1.4.1. Germany
7.1.4.1.1. Germany Interactive Sensors Market by Technology (2018-2027 USD Mn)
7.1.4.1.2. Germany Interactive Sensors Market by End-Use Industry (2018-2027 USD Mn)
7.1.4.2. U.K.
7.1.4.2.1. U.K. Interactive Sensors Market by Technology (2018-2027 USD Mn)
7.1.4.2.2. U.K. Interactive Sensors Market by End-Use Industry (2018-2027 USD Mn)
7.1.4.3. France
7.1.4.3.1. France Interactive Sensors Market by Technology (2018-2027 USD Mn)
7.1.4.3.2. France Interactive Sensors Market by End-Use Industry (2018-2027 USD Mn)
7.1.4.4. Italy
7.1.4.4.1. Italy Interactive Sensors Market by Technology (2018-2027 USD Mn)
7.1.4.4.2. Italy Interactive Sensors Market by End-Use Industry (2018-2027 USD Mn)
7.1.4.5. Rest of Europe
7.1.4.5.1. Rest of Europe Interactive Sensors Market by Technology (2018-2027 USD Mn)
7.1.4.5.2. Rest of Europe Interactive Sensors Market by End-Use Industry (2018-2027 USD Mn)
8. Asia Pacific Interactive Sensors Market Analysis and Forecast, 2018 – 2027 (USD Mn)
8.1.1. Overview
8.1.2. Asia Pacific Interactive Sensors Market by Technology (2018-2027 USD Mn)
8.1.3. Asia Pacific Interactive Sensors Market by End-Use Industry (2018-2027 USD Mn)
8.1.4. Asia Pacific Interactive Sensors Market by Country (2018-2027 USD Mn)
8.1.4.1. China
8.1.4.1.1. China Interactive Sensors Market by Technology (2018-2027 USD Mn)
8.1.4.1.2. China Interactive Sensors Market by End-Use Industry (2018-2027 USD Mn)
8.1.4.2. Japan
8.1.4.2.1. Japan Interactive Sensors Market by Technology (2018-2027 USD Mn)
8.1.4.2.2. Japan Interactive Sensors Market by End-Use Industry (2018-2027 USD Mn)
8.1.4.3. Rest of Asia Pacific
8.1.4.3.1. Rest of Asia Pacific Interactive Sensors Market by Technology (2018-2027 USD Mn)
8.1.4.3.2. Rest of Asia Pacific Interactive Sensors Market by End-Use Industry (2018-2027 USD Mn)
9. Latin America (LATAM) Interactive Sensors Market Analysis and Forecast, 2018 – 2027 (USD Mn)
9.1.1. Overview
9.1.2. Latin America Interactive Sensors Market by Technology (2018-2027 USD Mn)
9.1.3. Latin America Interactive Sensors Market by End-Use Industry (2018-2027 USD Mn)
9.1.4. Latin America Interactive Sensors Market by Country (2018-2027 USD Mn)
9.1.4.1. Brazil
9.1.4.1.1. Brazil Interactive Sensors Market by Technology (2018-2027 USD Mn)
9.1.4.1.2. Brazil Interactive Sensors Market by End-Use Industry (2018-2027 USD Mn)
9.1.4.2. Mexico
9.1.4.2.1. Mexico Interactive Sensors Market by Technology (2018-2027 USD Mn)
9.1.4.2.2. Mexico Interactive Sensors Market by End-Use Industry (2018-2027 USD Mn)
9.1.4.3. Rest of Latin America
9.1.4.3.1. Rest of Latin America Interactive Sensors Market by Technology (2018-2027 USD Mn)
9.1.4.3.2. Rest of Latin America Interactive Sensors Market by End-Use Industry (2018-2027 USD Mn)
10. Middle East and Africa Interactive Sensors Market Analysis and Forecast, 2018 – 2027 (USD Mn)
10.1.1. Overview
10.1.2. MEA Interactive Sensors Market by Technology (2018-2027 USD Mn)
10.1.3. MEA Interactive Sensors Market by End-Use Industry (2018-2027 USD Mn)
10.1.4. Middle East and Africa Interactive Sensors Market, by Country (2018-2027 USD Mn)
10.1.4.1. GCC
10.1.4.1.1. GCC Interactive Sensors Market by Technology (2018-2027 USD Mn)
10.1.4.1.2. GCC Interactive Sensors Market by End-Use Industry (2018-2027 USD Mn)
10.1.4.2. South Africa
10.1.4.2.1. South Africa Interactive Sensors Market by Technology (2018-2027 USD Mn)
10.1.4.2.2. South Africa Interactive Sensors Market by End-Use Industry (2018-2027 USD Mn)
10.1.4.3. Rest of MEA
10.1.4.3.1. Rest of MEA Interactive Sensors Market by Technology (2018-2027 USD Mn)
10.1.4.3.2. Rest of MEA Interactive Sensors Market by End-Use Industry (2018-2027 USD Mn)
11. Company Profiles
11.1. Google, Inc.
11.1.1. Business Description
11.1.2. Financial Health and Budget Allocation
11.1.3. Product Positions/Portfolio
11.1.4. Recent Development
11.1.5. SWOT Analysis
11.2. Microchip Technology, Inc.
11.2.1. Business Description
11.2.2. Financial Health and Budget Allocation
11.2.3. Product Positions/Portfolio
11.2.4. Recent Development
11.2.5. SWOT Analysis
11.3. Infineon Technologies
11.3.1. Business Description
11.3.2. Financial Health and Budget Allocation
11.3.3. Product Positions/Portfolio
11.3.4. Recent Development
11.3.5. SWOT Analysis
11.4. NXP Semiconductors NV
11.4.1. Business Description
11.4.2. Financial Health and Budget Allocation
11.4.3. Product Positions/Portfolio
11.4.4. Recent Development
11.4.5. SWOT Analysis
11.5. Robert Bosch GmbH
11.5.1. Business Description
11.5.2. Financial Health and Budget Allocation
11.5.3. Product Positions/Portfolio
11.5.4. Recent Development
11.5.5. SWOT Analysis
11.6. Texas Instruments
11.6.1. Business Description
11.6.2. Financial Health and Budget Allocation
11.6.3. Product Positions/Portfolio
11.6.4. Recent Development
11.6.5. SWOT Analysis
11.7. Acconeer AB
11.7.1. Business Description
11.7.2. Financial Health and Budget Allocation
11.7.3. Product Positions/Portfolio
11.7.4. Recent Development
11.7.5. SWOT Analysis
11.8. Analog Devices, Inc.
11.8.1. Business Description
11.8.2. Financial Health and Budget Allocation
11.8.3. Product Positions/Portfolio
11.8.4. Recent Development
11.8.5. SWOT Analysis
11.9. Omron Corporation
11.9.1. Business Description
11.9.2. Financial Health and Budget Allocation
11.9.3. Product Positions/Portfolio
11.9.4. Recent Development
11.9.5. SWOT Analysis
11.10. ABB Ltd.
11.10.1. Business Description
11.10.2. Financial Health and Budget Allocation
11.10.3. Product Positions/Portfolio
11.10.4. Recent Development
11.10.5. SWOT Analysis
$ 5200/- Multi User License

We understand that every business has unique requirements. This report can be customized based on:
- Deep regional & country-level market intelligence
- Application-specific and end-use industry segmentation
- Competitive landscape & strategic benchmarking
- Go-to-market and expansion strategy insights
- Custom data cuts aligned to your business goals
- Structured Primary Research Framework
- On-Demand Industry Expert Interviews Available
- Dedicated Analyst Support
- Custom Data On Request
- Post-Purchase Strategy Consultation
- Complimentary 30-min Analyst Session
- 30% of Our Clients Are Returning Enterprise Buyers
Our Clients


