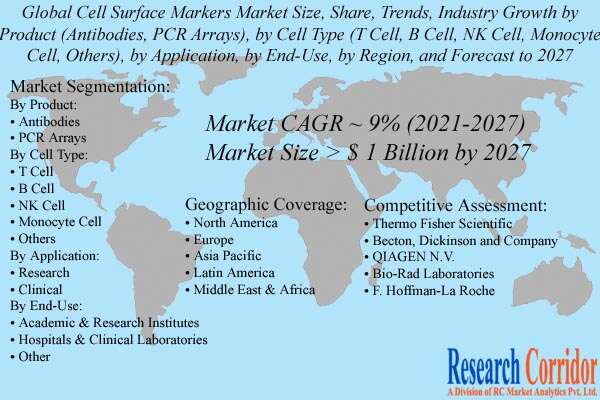
The global cell surface markers market size is expected to witness a significant CAGR of around 9% during the forecast period and estimated to reach over USD 1 billion by 2027. The rising prevalence of various types of cancer and the increasing research activities across the globe are some of the major factors to drive the market growth. As per the latest information shared by the World Health Organization (WHO), around 10 million deaths occurred in 2020 due to cancer worldwide. Furthermore, the increasing research and development activities in the pharmaceutical company, research institute, and CROs is further anticipated to fuel the market growth over the forecast period.
Market Drivers:
Advancements in Cell-Based Research: Cell surface markers play a crucial role in cell-based research, including immunology, cancer biology, stem cell research, and drug discovery. As scientific understanding and technological capabilities in these fields continue to advance, the demand for cell surface markers increases. Researchers rely on these markers to identify, characterize, and isolate specific cell populations, enabling a deeper understanding of cellular functions and disease mechanisms.
Increasing Focus on Precision Medicine: Precision medicine aims to tailor medical treatments to individual patients based on their unique genetic, environmental, and cellular characteristics. Cell surface markers are essential tools in precision medicine, facilitating the identification and selection of target cells for personalized therapies. The growing emphasis on precision medicine drives the demand for cell surface markers in diagnostic and therapeutic applications.
Rise in Chronic Diseases and Aging Population: The prevalence of chronic diseases, such as cancer, autoimmune disorders, and cardiovascular diseases, is increasing globally, primarily due to factors like aging populations and changing lifestyles. Cell surface markers are critical for diagnosing and monitoring these diseases, as they provide valuable information about disease progression, cell populations involved, and response to therapy. The growing incidence of chronic diseases contributes to the demand for cell surface markers.
Technological Advancements in Flow Cytometry and Cell Sorting: Flow cytometry and cell sorting technologies are widely used for the detection and analysis of cell surface markers. Ongoing advancements in these technologies, such as the development of high-throughput systems, multiplexing capabilities, and increased sensitivity, enhance the accuracy and efficiency of cell surface marker analysis. Technological innovations drive the adoption of cell surface markers in research and clinical settings.
Growing Adoption of Immunotherapy: Immunotherapy, which utilizes the body’s immune system to fight diseases like cancer, has gained significant attention and traction in recent years. Cell surface markers play a crucial role in identifying immune cell populations and assessing their functional characteristics, enabling the development and optimization of immunotherapies. The increasing adoption of immunotherapy approaches fuels the demand for cell surface markers.
Drug Development and Targeted Therapies: Cell surface markers serve as valuable targets for the development of targeted therapies and drug delivery systems. By specifically targeting cells expressing certain surface markers, researchers and pharmaceutical companies can develop therapies with higher efficacy and fewer off-target effects. The demand for cell surface markers increases as drug development focuses on personalized and targeted approaches.
Increased Funding for Life Sciences Research: Governments, private organizations, and funding agencies worldwide are providing substantial investments and grants for life sciences research. This financial support enables researchers to conduct extensive studies using cell surface markers, driving the demand for these markers. Funding initiatives further promote technological advancements, collaboration, and innovation in the field.
Diagnostic and Clinical Applications: Cell surface markers have significant applications in diagnostic and clinical settings. They are used for the identification and classification of cells, disease diagnosis, monitoring of treatment response, and patient stratification. The demand for accurate and reliable diagnostic tools and personalized treatment options drives the utilization of cell surface markers in clinical practice.
Increased Collaboration and Partnerships: Collaboration and partnerships between academic institutions, research organizations, pharmaceutical companies, and biotechnology firms are driving advancements in the cell surface markers field. These collaborations facilitate knowledge sharing, access to resources, and the development of innovative solutions, further propelling the market growth.
Market Snapshot:
| Benchmark Year | 2022 | ||
| Market Size | > USD 1 Billion by 2027 | ||
| Market Growth (CAGR) | ~ 9% (2023-2030) | ||
| Largest Market Share | North America | ||
| Analysis Period | 2020-2030 | ||
| Market Players | Thermo Fisher Scientific, Becton, Dickinson and Company, QIAGEN N.V., Bio-Rad Laboratories, and F. Hoffman-La Roche |
Market Insights:
The global cell surface markers market is bifurcated into the product, cell type, application, end-use, and geography. On the basis of product, the market is further segmented into antibodies and PCR arrays. The antibodies segment dominated the global market in 2020 and accounted to hold the largest revenue share of over two-thirds percent of the market by the end of the analysis period. The segment is also accounted to register the fastest growth rate over the forecast period.
On the basis of cell type, the market is segmented into T cell, B cell, NK cell, monocyte cell, and others the T cell surface markers segment dominated the global cell surface markers market in 2020 and is expected to grow at the same trends over the forecast period. The widespread use of this marker in diagnostic and various research activities is expected to drive the segment growth over the forecast period.
To know more about the study, request sample papers
The cell surface markers comprehensive study analyzes industry trends, market size, competitive analysis, and market forecast – 2021 to 2027. Research Corridor report provides detailed premium insight into the global market and reveals the potential revenue streams, commercial prospects, market drivers, challenges, opportunities, issues, and events affecting the industry. In addition, the report has a dedicated section covering market forecasts and analysis for leading geographies, profiles of major companies operating in the market, and expert opinion obtained from interviews with industry executives and experts from prominent companies.
The cell surface markers market research report presents the analysis of each segment from 2018 to 2027 considering 2020 as the base year for the research. The compounded annual growth rate (CAGR) for each respective segment is calculated for the forecast period from 2021 to 2027.
Historical & Forecast Period
- 2018-19 – Historical Year
- 2020 – Base Year
- 2021-2027 – Forecast Period
Market Segmentation:
By Product:
- Antibodies
- PCR Arrays
By Cell Type:
- T Cell
- B Cell
- NK Cell
- Monocyte Cell
- Others
By Application:
- Research
- Clinical
By End-Use:
- Academic & Research Institutes
- Hospitals & Clinical Laboratories
- Other
By Region:
- North America
- Europe
- Asia Pacific
- Latin America
- Middle East & Africa
Geographic Coverage
Geographically, North America dominated the global cell surface markers market in 2020 and accounted to hold the largest revenue share of over one-third of the market by the end of the analysis period. The increasing prevalence rate of different types of cancer is a primary factor to drive the market growth in the region. According to the latest information shared by National Cancer Institute, around 1.8 million new cancer cases were diagnosed in the United States in 2020, and 606,520 people die due to the cancer disease. Furthermore, the growing R&D activities are further anticipated to fuel the market growth in North America.
Competitive Assessment
Some of the major market players operating in the global cell surface markers market are Thermo Fisher Scientific, Becton, Dickinson and Company, QIAGEN N.V., Bio-Rad Laboratories, and F. Hoffman-La Roche. Companies are exploring markets through expansion, new investment, the introduction of new services, and collaboration as their preferred strategies. Players are exploring new geography through expansion and acquisition to gain a competitive advantage through joint synergy.
Key Companies:
- Thermo Fisher Scientific
- Becton, Dickinson and Company
- QIAGEN N.V.
- Bio-Rad Laboratories
- Hoffman-La Roche
- Abcam
- Danaher Corporation
- BioLegend
- GenScript
- Merck KGaA
Key Questions Answered by Cell Surface Markers Market Report
- Global cell surface markers market forecasts from 2021-2027
- Regional cell surface markers market forecasts from 2021-2027 covering Asia-Pacific, North America, Europe, Middle East & Africa, and Latin America
- Country-level forecasts from 2021-2027 covering 15 major countries from the regions as mentioned above
- Cell surface markers submarket forecasts from 2021-2027 covering the market by product, by cell type, by application, by end-use, and geography
- Various industry models such as SWOT analysis, Value Chain Analysis about cell surface markers market
- Analysis of the key factors driving and restraining the growth of the global, regional, and country-level cell surface markers markets from 2021-2027
- Competitive Landscape and market positioning of top 10 players operating in the cell surface markers market
1. Preface
1.1. Report Description
1.1.1. Purpose of the Report
1.1.2. Target Audience
1.1.3. USP and Key Offerings
1.2. Research Scope
1.3. Research Methodology
1.3.1. Phase I – Secondary Research
1.3.2. Phase II – Primary Research
1.3.3. Phase III – Expert Panel Review
1.4. Assumptions
2. Executive Summary
2.1. Global Polysulfides Market Portraiture
2.2. Global Polysulfides Market, by Product, 2020 (USD Mn)
2.3. Global Polysulfides Market, by Cell Type, 2020 (USD Mn)
2.4. Global Polysulfides Market, by Application, 2020 (USD Mn)
2.5. Global Polysulfides Market, by End-Use, 2020 (USD Mn)
2.6. Global Polysulfides Market, by Geography, 2020 (USD Mn)
3. Global Polysulfides Market Analysis
3.1. Polysulfides Market Overview
3.2. Market Inclination Insights
3.3. Market Dynamics
3.3.1. Drivers
3.3.2. Challenges
3.3.3. Opportunities
3.4. Attractive Investment Proposition
3.5. Competitive Analysis
3.6. Porter’s Five Force Analysis
3.6.1. Bargaining Power of Suppliers
3.6.2. Bargaining Power of Buyers
3.6.3. Threat of New Entrants
3.6.4. Threat of Substitutes
3.6.5. Degree of Competition
3.7. COVID-19 Impact Analysis
4. Global Polysulfides Market By Product, 2018 – 2027 (USD Mn)
4.1. Overview
4.2. Antibodies
4.3. PCR Arrays
5. Global Polysulfides Market By Cell Type, 2018 – 2027 (USD Mn)
5.1. Overview
5.2. T Cell
5.3. B Cell
5.4. NK Cell
5.5. Monocyte Cell
5.6. Others
6. Global Polysulfides Market By Application, 2018 – 2027 (USD Mn)
6.1. Overview
6.2. Research
6.3. Clinical
7. Global Polysulfides Market By End-Use, 2018 – 2027 (USD Mn)
7.1. Overview
7.2. Academic & Research Institutes
7.3. Hospitals & Clinical Laboratories
7.4. Other
8. North America Polysulfides Market Analysis and Forecast, 2018 – 2027 (USD Mn)
8.1.1. Overview
8.1.2. North America Polysulfides Market by Product (2018-2027 USD Mn)
8.1.3. North America Polysulfides Market by Cell Type (2018-2027 USD Mn)
8.1.4. North America Polysulfides Market by Application (2018-2027 USD Mn)
8.1.5. North America Polysulfides Market by End-Use (2018-2027 USD Mn)
8.1.6. North America Polysulfides Market by Country (2018-2027 USD Mn)
8.1.6.1. U.S.
8.1.6.1.1. U.S. Polysulfides Market by Product (2018-2027 USD Mn)
8.1.6.1.2. U.S. Polysulfides Market by Cell Type (2018-2027 USD Mn)
8.1.6.1.3. U.S. Polysulfides Market by Application (2018-2027 USD Mn)
8.1.6.1.4. U.S. Polysulfides Market by End-Use (2018-2027 USD Mn)
8.1.6.2. Canada
8.1.6.2.1. Canada Polysulfides Market by Product (2018-2027 USD Mn)
8.1.6.2.2. Canada Polysulfides Market by Cell Type (2018-2027 USD Mn)
8.1.6.2.3. Canada Polysulfides Market by Application (2018-2027 USD Mn)
8.1.6.2.4. Canada Polysulfides Market by End-Use (2018-2027 USD Mn)
9. Europe Polysulfides Market Analysis and Forecast, 2018 – 2027 (USD Mn)
9.1.1. Overview
9.1.2. Europe Polysulfides Market by Product (2018-2027 USD Mn)
9.1.3. Europe Polysulfides Market by Cell Type (2018-2027 USD Mn)
9.1.4. Europe Polysulfides Market by Application (2018-2027 USD Mn)
9.1.5. Europe Polysulfides Market by End-Use (2018-2027 USD Mn)
9.1.6. Europe Polysulfides Market by Country (2018-2027 USD Mn)
9.1.6.1. Germany
9.1.6.1.1. Germany Polysulfides Market by Product (2018-2027 USD Mn)
9.1.6.1.2. Germany Polysulfides Market by Cell Type (2018-2027 USD Mn)
9.1.6.1.3. Germany Polysulfides Market by Application (2018-2027 USD Mn)
9.1.6.1.4. Germany Polysulfides Market by End-Use (2018-2027 USD Mn)
9.1.6.2. U.K.
9.1.6.2.1. U.K. Polysulfides Market by Product (2018-2027 USD Mn)
9.1.6.2.2. U.K. Polysulfides Market by Cell Type (2018-2027 USD Mn)
9.1.6.2.3. U.K. Polysulfides Market by Application (2018-2027 USD Mn)
9.1.6.2.4. U.K. Polysulfides Market by End-Use (2018-2027 USD Mn)
9.1.6.3. France
9.1.6.3.1. France Polysulfides Market by Product (2018-2027 USD Mn)
9.1.6.3.2. France Polysulfides Market by Cell Type (2018-2027 USD Mn)
9.1.6.3.3. France Polysulfides Market by Application (2018-2027 USD Mn)
9.1.6.3.4. France Polysulfides Market by End-Use (2018-2027 USD Mn)
9.1.6.4. Italy
9.1.6.4.1. Italy Polysulfides Market by Product (2018-2027 USD Mn)
9.1.6.4.2. Italy Polysulfides Market by Cell Type (2018-2027 USD Mn)
9.1.6.4.3. Italy Polysulfides Market by Application (2018-2027 USD Mn)
9.1.6.4.4. Italy Polysulfides Market by End-Use (2018-2027 USD Mn)
9.1.6.5. Rest of Europe
9.1.6.5.1. Rest of Europe Polysulfides Market by Product (2018-2027 USD Mn)
9.1.6.5.2. Rest of Europe Polysulfides Market by Cell Type (2018-2027 USD Mn)
9.1.6.5.3. Rest of Europe Polysulfides Market by Application (2018-2027 USD Mn)
9.1.6.5.4. Rest of Europe Polysulfides Market by End-Use (2018-2027 USD Mn)
10. Asia Pacific Polysulfides Market Analysis and Forecast, 2018 – 2027 (USD Mn)
10.1.1. Overview
10.1.2. Asia Pacific Polysulfides Market by Product (2018-2027 USD Mn)
10.1.3. Asia Pacific Polysulfides Market by Cell Type (2018-2027 USD Mn)
10.1.4. Asia Pacific Polysulfides Market by Application (2018-2027 USD Mn)
10.1.5. Asia Pacific Polysulfides Market by End-Use (2018-2027 USD Mn)
10.1.6. Asia Pacific Polysulfides Market by Country (2018-2027 USD Mn)
10.1.6.1. China
10.1.6.1.1. China Polysulfides Market by Product (2018-2027 USD Mn)
10.1.6.1.2. China Polysulfides Market by Cell Type (2018-2027 USD Mn)
10.1.6.1.3. China Polysulfides Market by Application (2018-2027 USD Mn)
10.1.6.1.4. China Polysulfides Market by End-Use (2018-2027 USD Mn)
10.1.6.2. Japan
10.1.6.2.1. Japan Polysulfides Market by Product (2018-2027 USD Mn)
10.1.6.2.2. Japan Polysulfides Market by Cell Type (2018-2027 USD Mn)
10.1.6.2.3. Japan Polysulfides Market by Application (2018-2027 USD Mn)
10.1.6.2.4. Japan Polysulfides Market by End-Use (2018-2027 USD Mn)
10.1.6.3. Rest of Asia Pacific
10.1.6.3.1. Rest of Asia Pacific Polysulfides Market by Product (2018-2027 USD Mn)
10.1.6.3.2. Rest of Asia Pacific Polysulfides Market by Cell Type (2018-2027 USD Mn)
10.1.6.3.3. Rest of Asia Pacific Polysulfides Market by Application (2018-2027 USD Mn)
10.1.6.3.4. Rest of Asia Pacific Polysulfides Market by End-Use (2018-2027 USD Mn)
11. Latin America (LATAM) Polysulfides Market Analysis and Forecast, 2018 – 2027 (USD Mn)
11.1.1. Overview
11.1.2. Latin America Polysulfides Market by Product (2018-2027 USD Mn)
11.1.3. Latin America Polysulfides Market by Cell Type (2018-2027 USD Mn)
11.1.4. Latin America Polysulfides Market by Application (2018-2027 USD Mn)
11.1.5. Latin America Polysulfides Market by End-Use (2018-2027 USD Mn)
11.1.6. Latin America Polysulfides Market by Country (2018-2027 USD Mn)
11.1.6.1. Brazil
11.1.6.1.1. Brazil Polysulfides Market by Product (2018-2027 USD Mn)
11.1.6.1.2. Brazil Polysulfides Market by Cell Type (2018-2027 USD Mn)
11.1.6.1.3. Brazil Polysulfides Market by Application (2018-2027 USD Mn)
11.1.6.1.4. Brazil Polysulfides Market by End-Use (2018-2027 USD Mn)
11.1.6.2. Mexico
11.1.6.2.1. Mexico Polysulfides Market by Product (2018-2027 USD Mn)
11.1.6.2.2. Mexico Polysulfides Market by Cell Type (2018-2027 USD Mn)
11.1.6.2.3. Mexico Polysulfides Market by Application (2018-2027 USD Mn)
11.1.6.2.4. Mexico Polysulfides Market by End-Use (2018-2027 USD Mn)
11.1.6.3. Rest of Latin America
11.1.6.3.1. Rest of Latin America Polysulfides Market by Product (2018-2027 USD Mn)
11.1.6.3.2. Rest of Latin America Polysulfides Market by Cell Type (2018-2027 USD Mn)
11.1.6.3.3. Rest of Latin America Polysulfides Market by Application (2018-2027 USD Mn)
11.1.6.3.4. Rest of Latin America Polysulfides Market by End-Use (2018-2027 USD Mn)
12. Middle East and Africa Polysulfides Market Analysis and Forecast, 2018 – 2027 (USD Mn)
12.1.1. Overview
12.1.2. MEA Polysulfides Market by Product (2018-2027 USD Mn)
12.1.3. MEA Polysulfides Market by Cell Type (2018-2027 USD Mn)
12.1.4. MEA Polysulfides Market by Application (2018-2027 USD Mn)
12.1.5. MEA Polysulfides Market by End-Use (2018-2027 USD Mn)
12.1.6. Middle East and Africa Polysulfides Market, by Country (2018-2027 USD Mn)
12.1.6.1. GCC
12.1.6.1.1. GCC Polysulfides Market by Product (2018-2027 USD Mn)
12.1.6.1.2. GCC Polysulfides Market by Cell Type (2018-2027 USD Mn)
12.1.6.1.3. GCC Polysulfides Market by Application (2018-2027 USD Mn)
12.1.6.1.4. GCC Polysulfides Market by End-Use (2018-2027 USD Mn)
12.1.6.2. South Africa
12.1.6.2.1. South Africa Polysulfides Market by Product (2018-2027 USD Mn)
12.1.6.2.2. South Africa Polysulfides Market by Cell Type (2018-2027 USD Mn)
12.1.6.2.3. South Africa Polysulfides Market by Application (2018-2027 USD Mn)
12.1.6.2.4. South Africa Polysulfides Market by End-Use (2018-2027 USD Mn)
12.1.6.3. Rest of MEA
12.1.6.3.1. Rest of MEA Polysulfides Market by Product (2018-2027 USD Mn)
12.1.6.3.2. Rest of MEA Polysulfides Market by Cell Type (2018-2027 USD Mn)
12.1.6.3.3. Rest of MEA Polysulfides Market by Application (2018-2027 USD Mn)
12.1.6.3.4. Rest of MEA Polysulfides Market by End-Use (2018-2027 USD Mn)
13. Company Profiles
13.1. Thermo Fisher Scientific
13.1.1. Business Description
13.1.2. Financial Health and Budget Allocation
13.1.3. Product Positions/Portfolio
13.1.4. Recent Development
13.1.5. SWOT Analysis
13.2. Becton, Dickinson and Company
13.2.1. Business Description
13.2.2. Financial Health and Budget Allocation
13.2.3. Product Positions/Portfolio
13.2.4. Recent Development
13.2.5. SWOT Analysis
13.3. QIAGEN N.V.
13.3.1. Business Description
13.3.2. Financial Health and Budget Allocation
13.3.3. Product Positions/Portfolio
13.3.4. Recent Development
13.3.5. SWOT Analysis
13.4. Bio-Rad Laboratories
13.4.1. Business Description
13.4.2. Financial Health and Budget Allocation
13.4.3. Product Positions/Portfolio
13.4.4. Recent Development
13.4.5. SWOT Analysis
13.5. F. Hoffman-La Roche
13.5.1. Business Description
13.5.2. Financial Health and Budget Allocation
13.5.3. Product Positions/Portfolio
13.5.4. Recent Development
13.5.5. SWOT Analysis
13.6. Abcam
13.6.1. Business Description
13.6.2. Financial Health and Budget Allocation
13.6.3. Product Positions/Portfolio
13.6.4. Recent Development
13.6.5. SWOT Analysis
13.7. Danaher Corporation
13.7.1. Business Description
13.7.2. Financial Health and Budget Allocation
13.7.3. Product Positions/Portfolio
13.7.4. Recent Development
13.7.5. SWOT Analysis
13.8. BioLegend
13.8.1. Business Description
13.8.2. Financial Health and Budget Allocation
13.8.3. Product Positions/Portfolio
13.8.4. Recent Development
13.8.5. SWOT Analysis
13.9. GenScript
13.9.1. Business Description
13.9.2. Financial Health and Budget Allocation
13.9.3. Product Positions/Portfolio
13.9.4. Recent Development
13.9.5. SWOT Analysis
13.10. Merck KGaA
13.10.1. Business Description
13.10.2. Financial Health and Budget Allocation
13.10.3. Product Positions/Portfolio
13.10.4. Recent Development
13.10.5. SWOT Analysis
$ 3600/- Single User License
$ 5200/- Multi User License

We understand that every business has unique requirements. This report can be customized based on:
- Deep regional & country-level market intelligence
- Application-specific and end-use industry segmentation
- Competitive landscape & strategic benchmarking
- Go-to-market and expansion strategy insights
- Custom data cuts aligned to your business goals
- Structured Primary Research Framework
- On-Demand Industry Expert Interviews Available
- Dedicated Analyst Support
- Custom Data On Request
- Post-Purchase Strategy Consultation
- Complimentary 30-min Analyst Session
- 30% of Our Clients Are Returning Enterprise Buyers
Our Clients