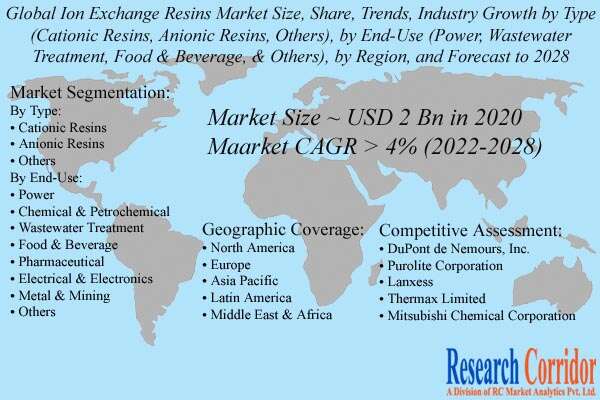
The global ion exchange resins market size was valued at around USD 2 billion in 2020 and is expected to witness a significant CAGR of over 4% during the forecast period 2022 to 2028. The rising awareness regarding water purification and softening in industrial applications is a primary factor to drive the market growth. Rapid growth in urbanization and growing industrialization in developing economies are further expected to fuel the market growth over the forecast period. Moreover, the increasing demand for products from various applications such as chemical processing, water treatment, power generation, and the increasing inclination toward sustainable wastewater treatment are projected to propel the market growth.
Market Drivers:
Growing Water Treatment Applications: The increasing demand for clean and safe water for various applications, including drinking water, industrial processes, and wastewater treatment, is a major driver for the ion exchange resins market. Ion exchange resins are widely used in water treatment processes to remove impurities, such as heavy metals, organic compounds, and hardness ions, and to soften water. The emphasis on water quality and the need for effective water treatment solutions drive the demand for ion exchange resins.
Expansion of the Pharmaceutical and Biotechnology Industries: The pharmaceutical and biotechnology industries rely on ion exchange resins for purification and separation processes. Ion exchange resins are used in drug manufacturing, chromatography, and protein purification to remove impurities and ensure the high purity of pharmaceutical products. The growth of these industries, driven by increasing healthcare needs and research activities, contributes to the demand for ion exchange resins.
Growing Demand for Industrial Processes: Ion exchange resins find extensive applications in various industrial processes, including chemical manufacturing, food and beverage production, mining, and power generation. They are used for purification, separation, metal recovery, and catalysis in these industries. The expansion of industrial activities, driven by economic growth and industrialization, drives the demand for ion exchange resins.
Environmental Regulations and Water Scarcity Concerns: Environmental regulations and the need for sustainable water management practices drive the adoption of ion exchange resins. Regulations governing wastewater discharge, water reuse, and the removal of contaminants from industrial effluents require effective water treatment solutions, including the use of ion exchange resins. Additionally, water scarcity concerns in many regions create a demand for technologies that enable efficient water treatment and resource conservation.
Increasing Demand for High-Purity Products: Several industries, such as electronics, pharmaceuticals, and power generation, require high-purity materials for their manufacturing processes. Ion exchange resins are used to remove impurities and achieve the desired level of purity in these industries. The demand for high-purity products drives the adoption of ion exchange resins.
Technological Advancements and Product Innovations: Technological advancements in ion exchange resin manufacturing, such as the development of new resin types, improved resin properties, and better regeneration techniques, drive the growth of the market. Product innovations that enhance the efficiency, selectivity, and capacity of ion exchange resins make them more attractive for various applications. Continuous research and development efforts contribute to the expansion of the ion exchange resins market.
Focus on Sustainability and Green Technologies: There is a growing emphasis on sustainability and the use of green technologies in various industries. Ion exchange resins offer advantages such as reusability, regenerability, and reduced waste generation compared to other water treatment methods. The focus on sustainable practices and the adoption of green technologies drive the demand for ion exchange resins.
Increasing Demand in Emerging Markets: The emerging markets, particularly in Asia-Pacific and Latin America, are witnessing rapid industrialization, urbanization, and infrastructure development. These regions have increasing water treatment needs, driven by population growth, rising living standards, and regulatory requirements. The expanding industrial and municipal sectors in these markets contribute to the demand for ion exchange resins.
Market Snapshot:
| Benchmark Year | 2022 | ||
| Market Size | ~ USD 2 Billion in 2020 | ||
| Market Growth (CAGR) | > 4% (2023-2030) | ||
| Largest Market Share | Asia Pacific | ||
| Analysis Period | 2020-2030 | ||
| Market Players | DuPont de Nemours, Inc., Purolite Corporation, Lanxess, Thermax Limited, and Mitsubishi Chemical Corporation |
Market Insights:
By Type, the cationic resins segment is expected to hold the largest share of the ion exchange resins market
The global ion exchange resins market is bifurcated into type, application, and geography. On the basis of type, the market is further segmented into cationic resins, anionic resins, and others. The cationic resins segment dominated the global market in 2020 and is expected to hold the largest revenue share of over half of the market by the end of the analysis period. The widespread use of the product in various end-use industries for dealkalization and demineralization is a major factor to drive the segment growth. Furthermore, the rapid growth in urbanization and the growing demand for water treatment in developing economies are further anticipated to fuel the segment growth.
By end-use, the power segment dominated the global ion exchange resins market
On the basis of end-use, the market is segmented into Power, Chemical & Petrochemical, Wastewater Treatment, Food & Beverage, Pharmaceutical, Electrical & Electronics, Metal & Mining, and Others. The power segment dominated the global ion exchange resins market in 2020 and is expected to hold the largest market share of over one-third of the market by the end of the analysis period. The increasing demand for the product in fossil power plants is a primary factor to drive the segment growth. Furthermore, the growing power industry in developing economies such as India, China is further expected to fuel the segment growth. Moreover, the increasing demand for ion exchange resins in various industries such as chemicals, petrochemicals, and food & beverage is further expected to drive the market.
To know more about the study, request a report sample
The ion exchange resins comprehensive study analyzes industry trends, market size, competitive analysis, and market forecast – 2022 to 2028. Research Corridor report provides detailed premium insight into the global market and reveals the potential revenue streams, commercial prospects, market drivers, challenges, opportunities, issues, and events affecting the industry. In addition, the report has a dedicated section covering market forecasts and analysis for leading geographies, profiles of major companies operating in the market and expert opinion obtained from interviews with industry executives and experts from prominent companies.
The ion exchange resins market research report presents the analysis of each segment from 2019 to 2028 considering 2020 as the base year for the research. The compounded annual growth rate (CAGR) for each respective segment is calculated for the forecast period from 2021 to 2027.
Historical & Forecast Period
- 2019-20 – Historical Year
- 2021 – Base Year
- 2022-2028 – Forecast Period
Market Segmentation:
By Type:
- Cationic Resins
- Anionic Resins
- Others (Adsorbent Resins & Chelation Resins)
By End-Use:
- Power
- Chemical & Petrochemical
- Wastewater Treatment
- Food & Beverage
- Pharmaceutical
- Electrical & Electronics
- Metal & Mining
- Others (Textile, Agriculture, and Oil & Gas)
By Region:
- North America
- Europe
- Asia Pacific
- Latin America
- Middle East & Africa
Geographic Coverage:
The Asia Pacific is expected to hold the largest share of the global ion exchange resins market by 2028
Geographically, the Asia Pacific dominated the global ion exchange resins market in 2020 and accounted to hold the largest revenue share of over one-third share of the market by 2028. The continuous expansion of the energy and power industry is a major factor to drive the market growth in the region. Furthermore, the growing urbanization and the continuous growth in end-use industries such as pharmaceuticals, nuclear energy, and mining are further expected to fuel the market in the Asia Pacific. Moreover, the increasing awareness regarding water recycling and reuse is anticipated to uplift the market growth in the region.
Regional Analysis:
Some of the major market players operating in the global ion exchange resins market are DuPont de Nemours, Inc., Purolite Corporation, Lanxess, Thermax Limited, and Mitsubishi Chemical Corporation. Companies are exploring markets through expansion, new investment, the introduction of new services, and collaboration as their preferred strategies. Players are exploring new geography through expansion and acquisition to gain a competitive advantage through joint synergy.
Key Companies:
- DuPont de Nemours, Inc.
- Purolite Corporation
- Lanxess
- Thermax Limited
- Mitsubishi Chemical Corporation
- Ion Exchange (India) Ltd.
- Samyang Corporation
- Novasep Holding
- Sunresin New Materials Co., Ltd.
- Bio-Rad Laboratories, Inc.
Key Questions Answered by Ion Exchange Resins Market Report
- Global ion exchange resins market forecasts from 2022-2028
- Regional market forecasts from 2022-2028 covering Asia-Pacific, North America, Europe, Middle East & Africa, and Latin America
- Country-level forecasts from 2022-2028 covering 15 major countries from the regions as mentioned above
- Ion exchange resins submarket forecasts from 2022-2028 covering the market by type, by end-use, and geography
- Various industry models such as SWOT analysis, Value Chain Analysis about the market
- Analysis of the key factors driving and restraining the growth of the global, regional, and country-level ion exchange resins markets from 2022-2028
- Competitive Landscape and market positioning of top 10 players operating in the market
1. Preface
1.1. Report Description
1.1.1. Purpose of the Report
1.1.2. Target Audience
1.1.3. USP and Key Offerings
1.2. Research Scope
1.3. Research Methodology
1.3.1. Phase I – Secondary Research
1.3.2. Phase II – Primary Research
1.3.3. Phase III – Expert Panel Review
1.4. Assumptions
2. Executive Summary
2.1. Global Ion Exchange Resins Market Portraiture
2.2. Global Ion Exchange Resins Market, by Type, 2021 (USD Mn)
2.3. Global Ion Exchange Resins Market, by End-Use, 2021 (USD Mn)
2.4. Global Ion Exchange Resins Market, by Geography, 2021 (USD Mn)
3. Global Ion Exchange Resins Market Analysis
3.1. Ion Exchange Resins Market Overview
3.2. Market Inclination Insights
3.3. Market Dynamics
3.3.1. Drivers
3.3.2. Challenges
3.3.3. Opportunities
3.4. Attractive Investment Proposition
3.5. Competitive Analysis
3.6. Porter’s Five Force Analysis
3.6.1. Bargaining Power of Suppliers
3.6.2. Bargaining Power of Buyers
3.6.3. Threat of New Entrants
3.6.4. Threat of Substitutes
3.6.5. Degree of Competition
3.7. COVID-19 Impact Analysis
4. Global Ion Exchange Resins Market By Type, 2019 – 2028 (USD Mn)
4.1. Overview
4.2. Cationic Resins
4.3. Anionic Resins
4.4. Others (Adsorbent Resins & Chelation Resins)
5. Global Ion Exchange Resins Market By End-Use, 2019 – 2028 (USD Mn)
5.1. Overview
5.2. Power
5.3. Chemical & Petrochemical
5.4. Wastewater Treatment
5.5. Food & Beverage
5.6. Pharmaceutical
5.7. Electrical & Electronics
5.8. Metal & Mining
5.9. Others (Textile, Agriculture, and Oil & Gas)
6. North America Ion Exchange Resins Market Analysis and Forecast, 2019 – 2028 (USD Mn)
6.1.1. Overview
6.1.2. North America Ion Exchange Resins Market by Type (2019-2028 USD Mn)
6.1.3. North America Ion Exchange Resins Market by End-Use (2019-2028 USD Mn)
6.1.4. North America Ion Exchange Resins Market by Country (2019-2028 USD Mn)
6.1.4.1. U.S.
6.1.4.1.1. U.S. Ion Exchange Resins Market by Type (2019-2028 USD Mn)
6.1.4.1.2. U.S. Ion Exchange Resins Market by End-Use (2019-2028 USD Mn)
6.1.4.2. Canada
6.1.4.2.1. Canada Ion Exchange Resins Market by Type (2019-2028 USD Mn)
6.1.4.2.2. Canada Ion Exchange Resins Market by End-Use (2019-2028 USD Mn)
7. Europe Ion Exchange Resins Market Analysis and Forecast, 2019 – 2028 (USD Mn)
7.1.1. Overview
7.1.2. Europe Ion Exchange Resins Market by Type (2019-2028 USD Mn)
7.1.3. Europe Ion Exchange Resins Market by End-Use (2019-2028 USD Mn)
7.1.4. Europe Ion Exchange Resins Market by Country (2019-2028 USD Mn)
7.1.4.1. Germany
7.1.4.1.1. Germany Ion Exchange Resins Market by Type (2019-2028 USD Mn)
7.1.4.1.2. Germany Ion Exchange Resins Market by End-Use (2019-2028 USD Mn)
7.1.4.2. U.K.
7.1.4.2.1. U.K. Ion Exchange Resins Market by Type (2019-2028 USD Mn)
7.1.4.2.2. U.K. Ion Exchange Resins Market by End-Use (2019-2028 USD Mn)
7.1.4.3. France
7.1.4.3.1. France Ion Exchange Resins Market by Type (2019-2028 USD Mn)
7.1.4.3.2. France Ion Exchange Resins Market by End-Use (2019-2028 USD Mn)
7.1.4.4. Italy
7.1.4.4.1. Italy Ion Exchange Resins Market by Type (2019-2028 USD Mn)
7.1.4.4.2. Italy Ion Exchange Resins Market by End-Use (2019-2028 USD Mn)
7.1.4.5. Rest of Europe
7.1.4.5.1. Rest of Europe Ion Exchange Resins Market by Type (2019-2028 USD Mn)
7.1.4.5.2. Rest of Europe Ion Exchange Resins Market by End-Use (2019-2028 USD Mn)
8. Asia Pacific Ion Exchange Resins Market Analysis and Forecast, 2019 – 2028 (USD Mn)
8.1.1. Overview
8.1.2. Asia Pacific Ion Exchange Resins Market by Type (2019-2028 USD Mn)
8.1.3. Asia Pacific Ion Exchange Resins Market by End-Use (2019-2028 USD Mn)
8.1.4. Asia Pacific Ion Exchange Resins Market by Country (2019-2028 USD Mn)
8.1.4.1. China
8.1.4.1.1. China Ion Exchange Resins Market by Type (2019-2028 USD Mn)
8.1.4.1.2. China Ion Exchange Resins Market by End-Use (2019-2028 USD Mn)
8.1.4.2. Japan
8.1.4.2.1. Japan Ion Exchange Resins Market by Type (2019-2028 USD Mn)
8.1.4.2.2. Japan Ion Exchange Resins Market by End-Use (2019-2028 USD Mn)
8.1.4.3. Rest of Asia Pacific
8.1.4.3.1. Rest of Asia Pacific Ion Exchange Resins Market by Type (2019-2028 USD Mn)
8.1.4.3.2. Rest of Asia Pacific Ion Exchange Resins Market by End-Use (2019-2028 USD Mn)
9. Latin America (LATAM) Ion Exchange Resins Market Analysis and Forecast, 2019 – 2028 (USD Mn)
9.1.1. Overview
9.1.2. Latin America Ion Exchange Resins Market by Type (2019-2028 USD Mn)
9.1.3. Latin America Ion Exchange Resins Market by End-Use (2019-2028 USD Mn)
9.1.4. Latin America Ion Exchange Resins Market by Country (2019-2028 USD Mn)
9.1.4.1. Brazil
9.1.4.1.1. Brazil Ion Exchange Resins Market by Type (2019-2028 USD Mn)
9.1.4.1.2. Brazil Ion Exchange Resins Market by End-Use (2019-2028 USD Mn)
9.1.4.2. Mexico
9.1.4.2.1. Mexico Ion Exchange Resins Market by Type (2019-2028 USD Mn)
9.1.4.2.2. Mexico Ion Exchange Resins Market by End-Use (2019-2028 USD Mn)
9.1.4.3. Rest of Latin America
9.1.4.3.1. Rest of Latin America Ion Exchange Resins Market by Type (2019-2028 USD Mn)
9.1.4.3.2. Rest of Latin America Ion Exchange Resins Market by End-Use (2019-2028 USD Mn)
10. Middle East and Africa Ion Exchange Resins Market Analysis and Forecast, 2019 – 2028 (USD Mn)
10.1.1. Overview
10.1.2. MEA Ion Exchange Resins Market by Type (2019-2028 USD Mn)
10.1.3. MEA Ion Exchange Resins Market by End-Use (2019-2028 USD Mn)
10.1.4. Middle East and Africa Ion Exchange Resins Market, by Country (2019-2028 USD Mn)
10.1.4.1. GCC
10.1.4.1.1. GCC Ion Exchange Resins Market by Type (2019-2028 USD Mn)
10.1.4.1.2. GCC Ion Exchange Resins Market by End-Use (2019-2028 USD Mn)
10.1.4.2. South Africa
10.1.4.2.1. South Africa Ion Exchange Resins Market by Type (2019-2028 USD Mn)
10.1.4.2.2. South Africa Ion Exchange Resins Market by End-Use (2019-2028 USD Mn)
10.1.4.3. Rest of MEA
10.1.4.3.1. Rest of MEA Ion Exchange Resins Market by Type (2019-2028 USD Mn)
10.1.4.3.2. Rest of MEA Ion Exchange Resins Market by End-Use (2019-2028 USD Mn)
11. Company Profiles
11.1. DuPont de Nemours, Inc.
11.1.1. Business Description
11.1.2. Financial Health and Budget Allocation
11.1.3. Product Positions/Portfolio
11.1.4. Recent Development
11.1.5. SWOT Analysis
11.2. Purolite Corporation
11.2.1. Business Description
11.2.2. Financial Health and Budget Allocation
11.2.3. Product Positions/Portfolio
11.2.4. Recent Development
11.2.5. SWOT Analysis
11.3. Lanxess
11.3.1. Business Description
11.3.2. Financial Health and Budget Allocation
11.3.3. Product Positions/Portfolio
11.3.4. Recent Development
11.3.5. SWOT Analysis
11.4. Thermax Limited
11.4.1. Business Description
11.4.2. Financial Health and Budget Allocation
11.4.3. Product Positions/Portfolio
11.4.4. Recent Development
11.4.5. SWOT Analysis
11.5. Mitsubishi Chemical Corporation
11.5.1. Business Description
11.5.2. Financial Health and Budget Allocation
11.5.3. Product Positions/Portfolio
11.5.4. Recent Development
11.5.5. SWOT Analysis
11.6. Ion Exchange (India) Ltd.
11.6.1. Business Description
11.6.2. Financial Health and Budget Allocation
11.6.3. Product Positions/Portfolio
11.6.4. Recent Development
11.6.5. SWOT Analysis
11.7. Samyang Corporation
11.7.1. Business Description
11.7.2. Financial Health and Budget Allocation
11.7.3. Product Positions/Portfolio
11.7.4. Recent Development
11.7.5. SWOT Analysis
11.8. Novasep Holding
11.8.1. Business Description
11.8.2. Financial Health and Budget Allocation
11.8.3. Product Positions/Portfolio
11.8.4. Recent Development
11.8.5. SWOT Analysis
11.9. Sunresin New Materials Co., Ltd.
11.9.1. Business Description
11.9.2. Financial Health and Budget Allocation
11.9.3. Product Positions/Portfolio
11.9.4. Recent Development
11.9.5. SWOT Analysis
11.10. Bio-Rad Laboratories, Inc.
11.10.1. Business Description
11.10.2. Financial Health and Budget Allocation
11.10.3. Product Positions/Portfolio
11.10.4. Recent Development
11.10.5. SWOT Analysis
$ 3600/- Single User License
$ 5200/- Multi User License

We understand that every business has unique requirements. This report can be customized based on:
- Deep regional & country-level market intelligence
- Application-specific and end-use industry segmentation
- Competitive landscape & strategic benchmarking
- Go-to-market and expansion strategy insights
- Custom data cuts aligned to your business goals
- Structured Primary Research Framework
- On-Demand Industry Expert Interviews Available
- Dedicated Analyst Support
- Custom Data On Request
- Post-Purchase Strategy Consultation
- Complimentary 30-min Analyst Session
- 30% of Our Clients Are Returning Enterprise Buyers
Our Clients