
The global thermal interface materials market size is anticipated to register a significant CAGR of over 10% during the forecast period 2021 to 2027. The increasing application of electronics in various end-use industries such as computer, automotive, telecom, healthcare, and industrial sector is a major factor to drive the market growth. Furthermore, the increasing penetration of smart devices, rising demand for electrical vehicles, and the demand for LED are further anticipated to fuel the market growth over the forecast period. In addition, the electrification of vehicles is expected to provide new opportunities in the market.
Market Drivers:
Increasing Electronic Device Miniaturization: The trend toward electronic device miniaturization, such as smartphones, tablets, laptops, and wearables, drives the demand for efficient thermal management solutions. As electronic components become smaller and more powerful, they generate higher levels of heat. Thermal interface materials play a crucial role in dissipating this heat and preventing overheating, which can impact device performance and reliability. The need for effective thermal management solutions in compact electronic devices fuels the demand for thermal interface materials.
Growing Demand for High-Performance Computing: The increasing demand for high-performance computing (HPC) applications, such as data centers, cloud computing, artificial intelligence, and virtual reality, drives the thermal interface materials market. HPC systems generate substantial heat due to the high processing power and intensive computational tasks involved. Thermal interface materials help optimize heat transfer between electronic components and cooling systems, ensuring efficient thermal management in HPC environments.
Advancements in Automotive Electronics: The automotive industry is witnessing significant advancements in electronic systems and components. Advanced driver-assistance systems (ADAS), infotainment systems, electric vehicle components, and autonomous driving technologies generate substantial heat. Thermal interface materials are essential for managing heat dissipation in automotive electronics, preventing overheating, and ensuring optimal performance and reliability. The increasing integration of electronic systems in vehicles drives the demand for thermal interface materials.
Growing Adoption of LED Lighting: LED lighting technology has gained significant popularity due to its energy efficiency, longer lifespan, and environmental benefits. However, LEDs also generate heat that needs to be effectively dissipated to maintain performance and extend their lifespan. Thermal interface materials play a critical role in thermal management for LED lighting applications, enabling efficient heat transfer from the LED chips to heat sinks. The growing adoption of LED lighting in residential, commercial, and industrial sectors drives the demand for thermal interface materials.
Expansion of the Electric Vehicle Market: The rapid growth of the electric vehicle (EV) market presents opportunities for the thermal interface materials market. EVs utilize advanced power electronics, battery systems, and electric motors that generate significant heat. Efficient thermal management is crucial for maintaining the performance, reliability, and lifespan of EV components. Thermal interface materials help dissipate heat from critical EV components, such as power electronics modules and battery packs, ensuring optimal thermal performance in EVs.
Technological Advancements in Thermal Interface Materials: Technological advancements in thermal interface materials contribute to market growth. Continuous research and development efforts have led to the introduction of new materials with improved thermal conductivity, lower thermal resistance, and enhanced performance characteristics. Advanced materials, such as phase change materials, thermal greases, thermal pads, and thermal films, offer better heat dissipation properties, improved reliability, and ease of application. Technological advancements drive the adoption of thermal interface materials in various industries.
Increasing Demand for Energy-Efficient Devices: The emphasis on energy efficiency and sustainability drives the demand for thermal interface materials. Efficient thermal management reduces energy consumption and improves the overall efficiency of electronic devices, leading to energy savings. Thermal interface materials enable better heat transfer and heat dissipation, allowing devices to operate at lower temperatures and reducing the need for active cooling mechanisms. The increasing demand for energy-efficient devices in various sectors, including electronics, telecommunications, and industrial applications, boosts the adoption of thermal interface materials.
Focus on Reliability and Longevity: Reliability and longevity are critical factors in the performance and lifespan of electronic devices and systems. Effective thermal management using thermal interface materials helps prevent overheating, thermal stress, and premature component failure. Industries such as aerospace, defense, medical devices, and industrial automation prioritize reliability and longevity in their applications.
Market Snapshot:
| Benchmark Year | 2022 | ||
| Market Size | lock | ||
| Market Growth (CAGR) | > 10% (2023-2030) | ||
| Largest Market Share | Asia Pacific | ||
| Analysis Period | 2020-2030 | ||
| Market Players | 3M Company, Dow Corning Company, Honeywell International, Inc., Indium Corporation, and Henkel AG & Co; KGaA. |
Market Insights:
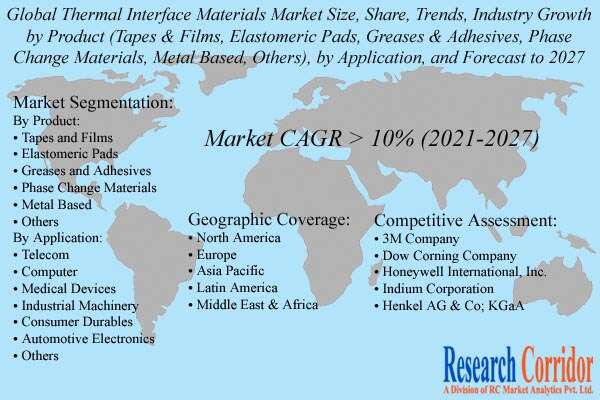
The global thermal interface materials market is bifurcated into product, application, and geography. On the basis of product, the market is further segmented into tapes & films, elastomeric pads, greases & adhesives, phase change materials, metal-based, and others. The greases and adhesive segment dominated the global market in 2020 and accounted to hold the largest market share of over one-third percent of the market. On the flip side, the phase change materials segment is anticipated to grow at the fastest growth rate over the forecast period. The growing construction activity is one of the key factor to drive the segment growth over the forecast period.
On the basis of application, the market is segmented into telecom, computer, medical devices, industrial machinery, and others. The computer segment dominated the global thermal interface materials market in 2020 and accounted to hold the largest market share of around one-fourth of the market by the end of the analysis period. The increasing penetration of desktops due to their affordable price and increasing trend of work from home amidst the COVID-19 pandemic are some of the major factors to drive the segment growth.
To know more about the report, request sample papers
The thermal interface materials comprehensive study analyzes industry trends, market size, competitive analysis, and market forecast – 2021 to 2027. Research Corridor report provides detailed premium insight into the global market and reveals the potential revenue streams, commercial prospects, market drivers, challenges, opportunities, issues, and events affecting the industry. In addition, the report has a dedicated section covering market forecasts and analysis for leading geographies, profiles of major companies operating in the market and expert opinion obtained from interviews with industry executives and experts from prominent companies.
The thermal interface materials market research report presents the analysis of each segment from 2018 to 2027 considering 2020 as the base year for the research. The compounded annual growth rate (CAGR) for each respective segment is calculated for the forecast period from 2021 to 2027.
Historical & Forecast Period
- 2018-19 – Historical Year
- 2020 – Base Year
- 2021-2027 – Forecast Period
Market Segmentation:
By Product:
- Tapes and Films
- Elastomeric Pads
- Greases and Adhesives
- Phase Change Materials
- Metal Based
- Others
By Application:
- Telecom
- Computer
- Medical Devices
- Industrial Machinery
- Consumer Durables
- Automotive Electronics
- Others
By Region:
- North America
- Europe
- Asia Pacific
- Latin America
- Middle East & Africa
Geographic Coverage
Geographically, the Asia Pacific dominated the global thermal interface materials market in 2020 and is estimated to hold the largest revenue share of over one-third percent of the market by the end of the analysis period. The presence of a large manufacturing base and the rising demand for the miniaturization of electronic devices are some of the major factors to drive the market growth in the region. Furthermore, the increasing disposable income per capita, changing lifestyle, and government-supportive policies are further expected to fuel the market growth in the Asia Pacific.
Competitive Assessment
Some of the leading market players operating in the global thermal interface materials market are 3M Company, Dow Corning Company, Honeywell International, Inc., Indium Corporation, and Henkel AG & Co; KGaA. Companies are exploring markets through expansion, new investment, the introduction of new services, and collaboration as their preferred strategies. Players are exploring new geography through expansion and acquisition to gain a competitive advantage through joint synergy.
Key Companies:
- 3M Company
- Dow Corning Company
- Honeywell International, Inc.
- Indium Corporation
- Henkel AG & Co; KGaA
- Parker Hannifin Corporation
- Fujipoly
- The Dow Chemical Company
- SIBELCO
- Shin-Etsu
Key Questions Answered by Thermal Interface Materials Market Report
- Global thermal interface materials market forecasts from 2021-2027
- Regional thermal interface materials market forecasts from 2021-2027 covering Asia-Pacific, North America, Europe, Middle East & Africa, and Latin America
- Country-level forecasts from 2021-2027 covering 15 major countries from the regions as mentioned above
- Thermal interface materials submarket forecasts from 2021-2027 covering the market by product, by application, and geography
- Various industry models such as SWOT analysis, Value Chain Analysis about thermal interface materials market
- Analysis of the key factors driving and restraining the growth of the global, regional, and country-level thermal interface materials markets from 2021-2027
- Competitive Landscape and market positioning of top 10 players operating in the thermal interface materials market
1. Preface
1.1. Report Description
1.1.1. Purpose of the Report
1.1.2. Target Audience
1.1.3. USP and Key Offerings
1.2. Research Scope
1.3. Research Methodology
1.3.1. Phase I – Secondary Research
1.3.2. Phase II – Primary Research
1.3.3. Phase III – Expert Panel Review
1.4. Assumptions
2. Executive Summary
2.1. Global Thermal Interface Materials Market Portraiture
2.2. Global Thermal Interface Materials Market, by Product, 2020 (USD Mn)
2.3. Global Thermal Interface Materials Market, by Application, 2020 (USD Mn)
2.4. Global Thermal Interface Materials Market, by Geography, 2020 (USD Mn)
3. Global Thermal Interface Materials Market Analysis
3.1. Thermal Interface Materials Market Overview
3.2. Market Inclination Insights
3.3. Market Dynamics
3.3.1. Drivers
3.3.2. Challenges
3.3.3. Opportunities
3.4. Attractive Investment Proposition
3.5. Competitive Analysis
3.6. Porter’s Five Force Analysis
3.6.1. Bargaining Power of Suppliers
3.6.2. Bargaining Power of Buyers
3.6.3. Threat of New Entrants
3.6.4. Threat of Substitutes
3.6.5. Degree of Competition
3.7. COVID-19 Impact Analysis
4. Global Thermal Interface Materials Market By Product, 2018 – 2027 (USD Mn)
4.1. Overview
4.2. Tapes and Films
4.3. Elastomeric Pads
4.4. Greases and Adhesives
4.5. Phase Change Materials
4.6. Metal Based
4.7. Others
5. Global Thermal Interface Materials Market By Application, 2018 – 2027 (USD Mn)
5.1. Overview
5.2. Telecom
5.3. Computer
5.4. Medical Devices
5.5. Industrial Machinery
5.6. Consumer Durables
5.7. Automotive Electronics
5.8. Others
6. North America Thermal Interface Materials Market Analysis and Forecast, 2018 – 2027 (USD Mn)
6.1.1. Overview
6.1.2. North America Thermal Interface Materials Market by Product (2018-2027 USD Mn)
6.1.3. North America Thermal Interface Materials Market by Application (2018-2027 USD Mn)
6.1.4. North America Thermal Interface Materials Market by Country (2018-2027 USD Mn)
6.1.4.1. U.S.
6.1.4.1.1. U.S. Thermal Interface Materials Market by Product (2018-2027 USD Mn)
6.1.4.1.2. U.S. Thermal Interface Materials Market by Application (2018-2027 USD Mn)
6.1.4.2. Canada
6.1.4.2.1. Canada Thermal Interface Materials Market by Product (2018-2027 USD Mn)
6.1.4.2.2. Canada Thermal Interface Materials Market by Application (2018-2027 USD Mn)
7. Europe Thermal Interface Materials Market Analysis and Forecast, 2018 – 2027 (USD Mn)
7.1.1. Overview
7.1.2. Europe Thermal Interface Materials Market by Product (2018-2027 USD Mn)
7.1.3. Europe Thermal Interface Materials Market by Application (2018-2027 USD Mn)
7.1.4. Europe Thermal Interface Materials Market by Country (2018-2027 USD Mn)
7.1.4.1. Germany
7.1.4.1.1. Germany Thermal Interface Materials Market by Product (2018-2027 USD Mn)
7.1.4.1.2. Germany Thermal Interface Materials Market by Application (2018-2027 USD Mn)
7.1.4.2. U.K.
7.1.4.2.1. U.K. Thermal Interface Materials Market by Product (2018-2027 USD Mn)
7.1.4.2.2. U.K. Thermal Interface Materials Market by Application (2018-2027 USD Mn)
7.1.4.3. France
7.1.4.3.1. France Thermal Interface Materials Market by Product (2018-2027 USD Mn)
7.1.4.3.2. France Thermal Interface Materials Market by Application (2018-2027 USD Mn)
7.1.4.4. Italy
7.1.4.4.1. Italy Thermal Interface Materials Market by Product (2018-2027 USD Mn)
7.1.4.4.2. Italy Thermal Interface Materials Market by Application (2018-2027 USD Mn)
7.1.4.5. Rest of Europe
7.1.4.5.1. Rest of Europe Thermal Interface Materials Market by Product (2018-2027 USD Mn)
7.1.4.5.2. Rest of Europe Thermal Interface Materials Market by Application (2018-2027 USD Mn)
8. Asia Pacific Thermal Interface Materials Market Analysis and Forecast, 2018 – 2027 (USD Mn)
8.1.1. Overview
8.1.2. Asia Pacific Thermal Interface Materials Market by Product (2018-2027 USD Mn)
8.1.3. Asia Pacific Thermal Interface Materials Market by Application (2018-2027 USD Mn)
8.1.4. Asia Pacific Thermal Interface Materials Market by Country (2018-2027 USD Mn)
8.1.4.1. China
8.1.4.1.1. China Thermal Interface Materials Market by Product (2018-2027 USD Mn)
8.1.4.1.2. China Thermal Interface Materials Market by Application (2018-2027 USD Mn)
8.1.4.2. Japan
8.1.4.2.1. Japan Thermal Interface Materials Market by Product (2018-2027 USD Mn)
8.1.4.2.2. Japan Thermal Interface Materials Market by Application (2018-2027 USD Mn)
8.1.4.3. Rest of Asia Pacific
8.1.4.3.1. Rest of Asia Pacific Thermal Interface Materials Market by Product (2018-2027 USD Mn)
8.1.4.3.2. Rest of Asia Pacific Thermal Interface Materials Market by Application (2018-2027 USD Mn)
9. Latin America (LATAM) Thermal Interface Materials Market Analysis and Forecast, 2018 – 2027 (USD Mn)
9.1.1. Overview
9.1.2. Latin America Thermal Interface Materials Market by Product (2018-2027 USD Mn)
9.1.3. Latin America Thermal Interface Materials Market by Application (2018-2027 USD Mn)
9.1.4. Latin America Thermal Interface Materials Market by Country (2018-2027 USD Mn)
9.1.4.1. Brazil
9.1.4.1.1. Brazil Thermal Interface Materials Market by Product (2018-2027 USD Mn)
9.1.4.1.2. Brazil Thermal Interface Materials Market by Application (2018-2027 USD Mn)
9.1.4.2. Mexico
9.1.4.2.1. Mexico Thermal Interface Materials Market by Product (2018-2027 USD Mn)
9.1.4.2.2. Mexico Thermal Interface Materials Market by Application (2018-2027 USD Mn)
9.1.4.3. Rest of Latin America
9.1.4.3.1. Rest of Latin America Thermal Interface Materials Market by Product (2018-2027 USD Mn)
9.1.4.3.2. Rest of Latin America Thermal Interface Materials Market by Application (2018-2027 USD Mn)
10. Middle East and Africa Thermal Interface Materials Market Analysis and Forecast, 2018 – 2027 (USD Mn)
10.1.1. Overview
10.1.2. MEA Thermal Interface Materials Market by Product (2018-2027 USD Mn)
10.1.3. MEA Thermal Interface Materials Market by Application (2018-2027 USD Mn)
10.1.4. Middle East and Africa Thermal Interface Materials Market, by Country (2018-2027 USD Mn)
10.1.4.1. GCC
10.1.4.1.1. GCC Thermal Interface Materials Market by Product (2018-2027 USD Mn)
10.1.4.1.2. GCC Thermal Interface Materials Market by Application (2018-2027 USD Mn)
10.1.4.2. South Africa
10.1.4.2.1. South Africa Thermal Interface Materials Market by Product (2018-2027 USD Mn)
10.1.4.2.2. South Africa Thermal Interface Materials Market by Application (2018-2027 USD Mn)
10.1.4.3. Rest of MEA
10.1.4.3.1. Rest of MEA Thermal Interface Materials Market by Product (2018-2027 USD Mn)
10.1.4.3.2. Rest of MEA Thermal Interface Materials Market by Application (2018-2027 USD Mn)
11. Company Profiles
11.1. 3M Company
11.1.1. Business Description
11.1.2. Financial Health and Budget Allocation
11.1.3. Product Positions/Portfolio
11.1.4. Recent Development
11.1.5. SWOT Analysis
11.2. Dow Corning Company
11.2.1. Business Description
11.2.2. Financial Health and Budget Allocation
11.2.3. Product Positions/Portfolio
11.2.4. Recent Development
11.2.5. SWOT Analysis
11.3. Honeywell International, Inc.
11.3.1. Business Description
11.3.2. Financial Health and Budget Allocation
11.3.3. Product Positions/Portfolio
11.3.4. Recent Development
11.3.5. SWOT Analysis
11.4. Indium Corporation
11.4.1. Business Description
11.4.2. Financial Health and Budget Allocation
11.4.3. Product Positions/Portfolio
11.4.4. Recent Development
11.4.5. SWOT Analysis
11.5. Henkel AG & Co; KGaA
11.5.1. Business Description
11.5.2. Financial Health and Budget Allocation
11.5.3. Product Positions/Portfolio
11.5.4. Recent Development
11.5.5. SWOT Analysis
11.6. Parker Hannifin Corporation
11.6.1. Business Description
11.6.2. Financial Health and Budget Allocation
11.6.3. Product Positions/Portfolio
11.6.4. Recent Development
11.6.5. SWOT Analysis
11.7. Fujipoly
11.7.1. Business Description
11.7.2. Financial Health and Budget Allocation
11.7.3. Product Positions/Portfolio
11.7.4. Recent Development
11.7.5. SWOT Analysis
11.8. The Dow Chemical Company
11.8.1. Business Description
11.8.2. Financial Health and Budget Allocation
11.8.3. Product Positions/Portfolio
11.8.4. Recent Development
11.8.5. SWOT Analysis
11.9. SIBELCO
11.9.1. Business Description
11.9.2. Financial Health and Budget Allocation
11.9.3. Product Positions/Portfolio
11.9.4. Recent Development
11.9.5. SWOT Analysis
11.10. Shin-Etsu
11.10.1. Business Description
11.10.2. Financial Health and Budget Allocation
11.10.3. Product Positions/Portfolio
11.10.4. Recent Development
11.10.5. SWOT Analysis

Still have questions? Get 15 minutes free consultation with our market expert before making a purchase.
We understand that every business has unique requirements. This report can be customized based on:
- Regional and country-level insights
- Specific application/industry breakdown
- Competitor benchmarking
- Market entry strategies
- Markets in over 100+ countries analyzed granularly
- 35% of our total client are returning clients
- 1000+ customers globally
- 100+ paid data sources mined to bring cutting-edge insights
- 24x5 availability - we are always there when you need us
- "Free of Cost Report Customization" is available
- Request a regional report at Best Price
- Ring Pull Caps Market Report
- Plastic Straps Market Report
- Transformer Oil Market Report
- Pneumatic Bolting Tool Market Report
- Piezoelectric Smart Material Market Report
- Sports Tourism Market Report
- Pharmaceutical Packaging Equipment Market Report
- Magnesium Photoengraving Plate Market Report
- Alkaline Battery Market Report
- Educational Toys Market Report
- Alkaline Ionizers Market Report
- Glass Reactor Market Report
Our Clients


